DevTools
QuantaJS DevTools provides a powerful visual debugging interface for inspecting stores, monitoring state changes, and tracking actions in real-time. Whether you're building a small prototype or a large-scale application, DevTools helps you understand and debug your state management with ease.
DevTools is opt-in as of 2.1:
Nothing is collected and nothing is attached to window until you call
enableDevTools(). This is a security change, not an ergonomic one — see
Why it is opt-in.
Features
✅ Real-time Store Inspector – View live state, getters, and actions
✅ Action Log – Track all state mutations with timestamps and payloads
✅ Opt-In – Collects nothing until explicitly enabled
✅ Redaction – Mask sensitive state paths and action arguments
✅ Framework Agnostic – Works with vanilla JS, React, or any framework
✅ Modern UI – Built with Preact and Shadow DOM, so it cannot leak styles into your app
✅ Out of Your Bundle – An optional peer dependency behind a dynamic import
✅ Persistence Management – View and manage persistence status for stores
Two pieces
DevTools is split in two, and you need both:
| Piece | From | Does |
|---|---|---|
| The bridge | enableDevTools() in @quantajs/core | Collects store state and action calls. Off by default. |
| The UI | mountDevTools() in @quantajs/devtools, or <QuantaDevTools /> in @quantajs/react/devtools | Renders the panel. |
Mount the UI without enabling the bridge and the panel appears empty — that is the symptom to recognise.
Installation
Install the DevTools package alongside the core library:
npm install @quantajs/devtools @quantajs/core
# or
yarn add @quantajs/devtools @quantajs/core
# or
pnpm add @quantajs/devtools @quantajs/core
Quick Start
import { defineStore, enableDevTools } from '@quantajs/core';

export const useCounterStore = defineStore('counter', {
  state: () => ({ count: 0 }),
  actions: {
    increment() {
      this.count++;
    },
  },
});

// 1. Turn on the bridge — only in development.
if (process.env.NODE_ENV === 'development') {
  enableDevTools();
}
// 2. Mount the UI.
import { mountDevTools } from '@quantajs/devtools';

mountDevTools();
A floating button appears in the bottom-right corner. Click it to open the panel.
Enable the bridge at your app's entry point. Stores created before it is
enabled are picked up too, so it also works when <QuantaDevTools> turns it on
after the first render.
Redacting sensitive values
DevTools observes everything: full store contents and every argument passed to every action. When that includes tokens or personal data, redact it:
enableDevTools({
  redact: ['token', 'user.ssn', 'payment.cardNumber'],
});
Paths are matched against the state and getter values the panel shows, keys
nested inside a changed value, and action arguments that are objects carrying a
matching key. Matches are replaced with [redacted].
Turning it back off
import { disableDevTools } from '@quantajs/core';

disableDevTools();
Mounting options
import { mountDevTools } from '@quantajs/devtools';

// Force the panel visible regardless of environment detection
mountDevTools({ visible: true });

// Mount into a specific element
mountDevTools({
  target: document.getElementById('devtools-container'),
});
Note:
mountDevTools({ visible }) controls only whether the panel renders. It has
no effect on data collection — that is enableDevTools(), and its default is
off. The two functions take different option objects that happen to share a
type name.
Using DevTools
Opening DevTools
Once mounted, you'll see a floating button with the QuantaJS logo in the bottom-right corner of your application. Click it to open the DevTools panel.
Store Inspector
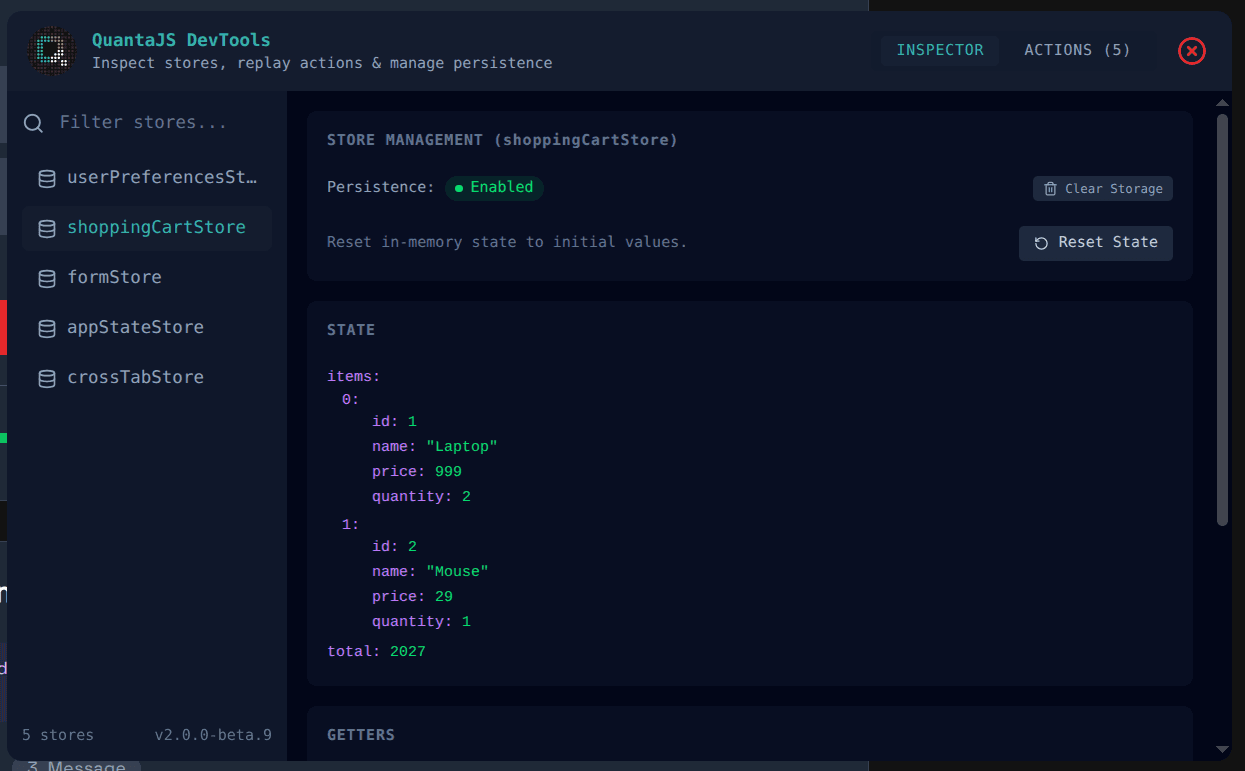
The Inspector tab provides a comprehensive view of your stores:
State Viewing
- Live State: See your store state update in real-time as you interact with your application
- Nested Objects: Expandable tree view for complex state structures
- Color-Coded Values: Different colors for keys, values, and types make it easy to scan
Getters
View all computed values (getters) alongside their current values. Getters are displayed with their computed results, making it easy to verify that your derived state is working correctly.
Actions
See all available actions for the selected store. You can even trigger actions directly from the DevTools by clicking the play button next to each action.
Store Management
- Persistence Status: See at a glance whether persistence is enabled for a store
- Clear Storage: Remove persisted data from storage (useful for testing)
- Reset State: Reset the store to its initial state values
Action Log
The Actions tab provides a complete history of all actions that have been dispatched:
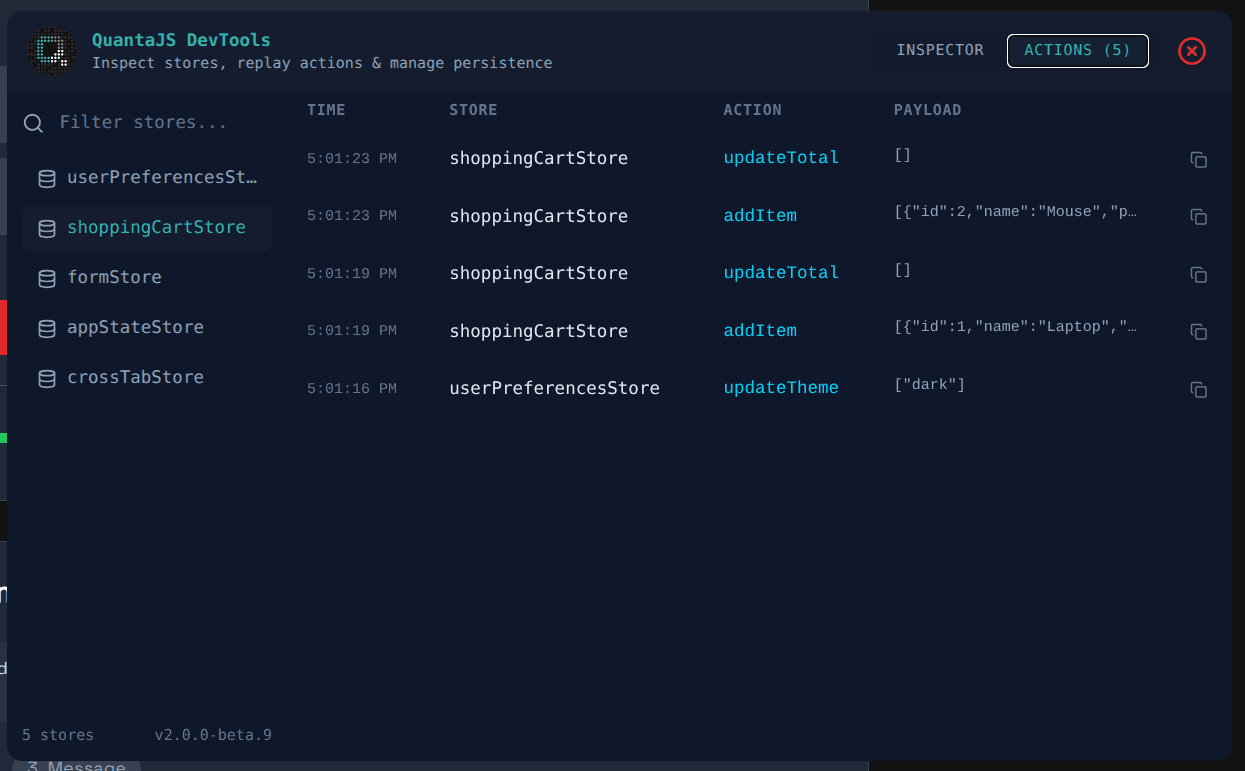
- Timestamps: See exactly when each action was called
- Store Context: Know which store each action belongs to
- Payloads: View the arguments passed to each action
- Expandable Payloads: Large payloads can be expanded to see full details
- Copy Payload: Copy action payloads to clipboard for debugging
The action log keeps track of the last 100 actions, giving you a comprehensive view of your application's state changes.
React Integration
If you're using React, you can use the QuantaDevTools component from
@quantajs/react/devtools:
import { enableDevTools } from '@quantajs/react';
import { QuantaDevTools } from '@quantajs/react/devtools';

if (process.env.NODE_ENV === 'development') {
  enableDevTools();
}

function App() {
  return (
    <div>
      <YourApp />
      <QuantaDevTools />
    </div>
  );
}
The component handles mounting and unmounting for you. @quantajs/devtools is
an optional peer dependency loaded through a dynamic import, so it stays out of
your production bundle — which is why @quantajs/react is 2.8 kB gzipped
rather than the 20.1 kB it was in 2.0.0.
It moved in 2.1.1:
In 2.1.0 this component was exported from @quantajs/react itself. Because it
dynamically imports @quantajs/devtools — a specifier bundlers resolve at build
time — that broke the build of every application which had not installed that
optional peer, whether or not it used DevTools at all. Importing from the
/devtools subpath is what confines the requirement to the apps that want the
panel. The old import still compiles but renders nothing and logs a warning.
In the Next.js App Router, put this in a file marked 'use client'.
Development vs Production
Why it is opt-in
Before 2.1, the DevTools bridge enabled itself whenever
process.env.NODE_ENV was not statically replaced at build time, and attached
itself to window at import time. That check holds under Vite, webpack and
Next.js — and fails everywhere else: a CDN bundle, Deno, a plain
<script type="module">. In those environments the bridge stayed on in
production, exposing every store's full contents and every action argument
(credentials, tokens, personal data) to any script running on the page.
Environment detection was the wrong mechanism for a security boundary. As of
2.1 the bridge attaches only after an explicit enableDevTools() call, so
there is no environment in which it turns itself on.
Keeping it out of production
if (process.env.NODE_ENV === 'development') {
  enableDevTools();
}
// Vite
if (import.meta.env.DEV) {
  enableDevTools();
}
The UI's own visibility check still auto-detects, so mountDevTools() with no
options will not render the panel in a production build. Treat that as a
convenience, not a guarantee — the guard that matters is the one around
enableDevTools().
Tree-Shaking
For production builds, you can exclude DevTools entirely using conditional imports:
if (process.env.NODE_ENV === 'development') {
  import('@quantajs/devtools').then(({ mountDevTools }) => {
    mountDevTools();
  });
}
Or with Vite:
if (import.meta.env.DEV) {
  import('@quantajs/devtools').then(({ mountDevTools }) => {
    mountDevTools();
  });
}
Advanced Usage
Custom Mount Target
Mount DevTools to a specific element instead of the body:
const container = document.getElementById('devtools-container');
mountDevTools({ target: container });
Cleanup
The mountDevTools function returns a cleanup function that you can call to unmount DevTools:
const cleanup = mountDevTools({ visible: true });

// Later, when you want to remove DevTools
cleanup();
Multiple Instances
While not recommended, you can mount multiple DevTools instances. Each will connect to the same store registry, so they'll show the same data.
Store Inspector Features
Real-Time Updates
The Store Inspector automatically updates when store state changes. You don't need to refresh or manually update the view—changes appear instantly.
Search and Filter
Use the search box in the sidebar to quickly find stores by name. This is especially useful when you have many stores in your application.
Store Selection
Click on any store in the sidebar to inspect it. The main panel will update to show that store's state, getters, and actions.
State Tree Navigation
Complex nested state is displayed as an expandable tree. Click through nested objects to explore your state structure.
Action Log Features
Action History
The Action Log maintains a history of the last 100 actions. Each action includes:
- Time: When the action was called
- Store: Which store the action belongs to
- Action Name: The name of the action that was called
- Payload: The arguments passed to the action
Payload Inspection
- Truncated View: Long payloads are truncated with an ellipsis
- Expand: Click the expand button to see the full payload
- Copy: Copy the payload JSON to your clipboard for debugging
Action Filtering
While the Action Log doesn't currently support filtering, you can use the browser's find feature (Ctrl+F / Cmd+F) to search through actions.
Best Practices
Development Only
Guard enableDevTools(), and load the UI through a dynamic import so it never
enters your production bundle:
if (process.env.NODE_ENV === 'development') {
  enableDevTools();
  const { mountDevTools } = await import('@quantajs/devtools');
  mountDevTools();
}
Redact Before You Need To
Add redact entries when you add the field, not after a screenshot has already
gone into a bug report:
enableDevTools({ redact: ['token', 'refreshToken', 'user.email'] });
Store Naming
Use descriptive store names to make it easier to identify stores in DevTools:
// ✅ Good - descriptive names
const useUserStore = defineStore('user', { /* ... */ });
const useCartStore = defineStore('shopping-cart', { /* ... */ });

// ❌ Bad - unclear names
const useStore1 = defineStore('s1', { /* ... */ });
const useDataStore = defineStore('data', { /* ... */ });
Action Naming
Use clear action names that describe what they do:
// ✅ Good - clear action names
actions: {
  incrementCounter() { /* ... */ },
  addItemToCart(item) { /* ... */ },
  updateUserProfile(profile) { /* ... */ },
}

// ❌ Bad - unclear action names
actions: {
  do() { /* ... */ },
  update() { /* ... */ },
  change(data) { /* ... */ },
}
Debugging Workflow
- Open DevTools when you start development
- Monitor Actions to understand the flow of state changes
- Inspect State to verify that state updates are correct
- Check Getters to ensure computed values are working
- Use Action Log to trace back through state changes when debugging issues
Troubleshooting
The panel is empty
This is the most common problem after upgrading to 2.1, and it has one cause:
enableDevTools() was never called. The UI mounts fine, but the bridge
collects nothing, so there is nothing to show.
DevTools not appearing at all
- Check the environment:
mountDevTools()with no options only renders when it detects development. Pass{ visible: true }to force it. - Check the mount: verify
mountDevTools()is actually running. - Check the console for errors.
- Check the target: if you passed a
target, make sure the element exists at mount time.
Some stores are missing
- The store is in a different container. A store in a per-request or
useLocalStorecontainer has its own lifetime and may already be disposed; destroyed stores are removed from the panel. - Duplicate names. Two stores sharing a name in one container are one store — the second resolution returns the first.
Actions not logging
- The bridge is off — see above.
- Verify the action is being called, not shadowed by a state key of the same name.
- Check
redact— a redacted payload still logs, but shows[redacted].
Learn More
- API Reference - Complete DevTools API documentation
- React Integration - Using DevTools with React
- Managing Stores - Best practices for store management
- Persistence Guide - Understanding persistence with DevTools
Spot something that needs improving?
Edit on GitHubEdit page